# Viewing Reports
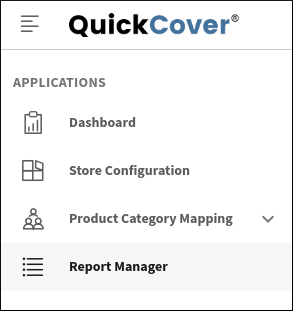
To view reports on the sales of service plans for your products, go to Applications > Report Manager.
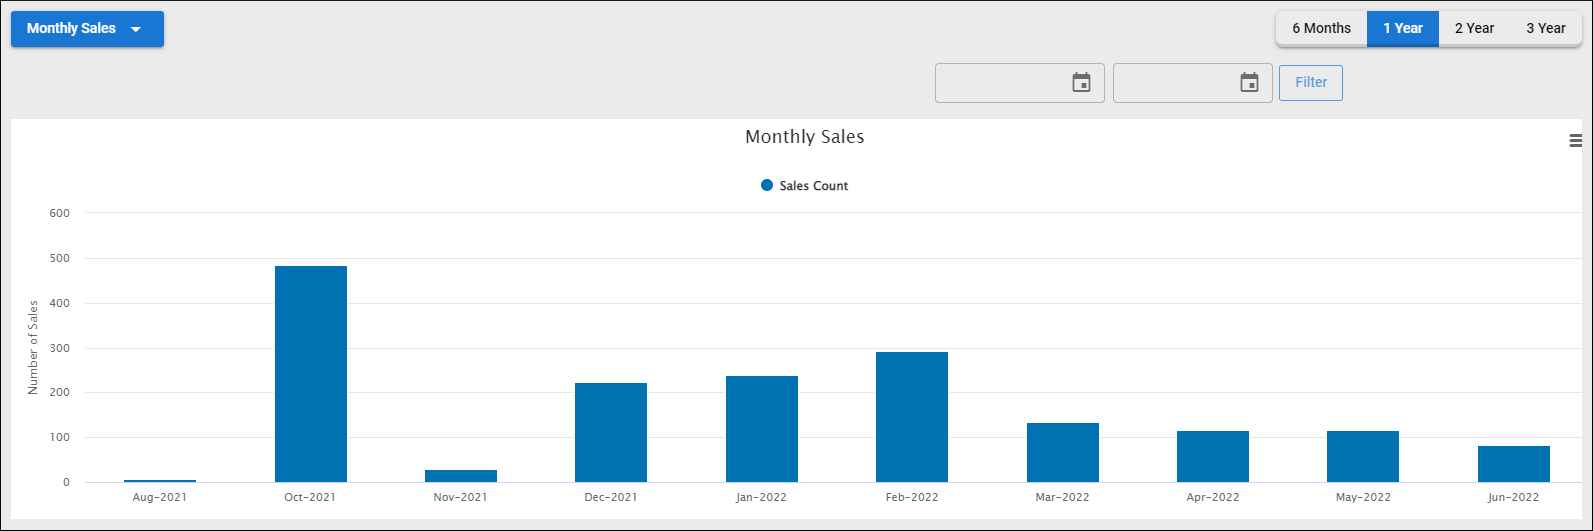
Report Manager presents the data as a chart and lists the data points in a table that can be exported to a CSV file.
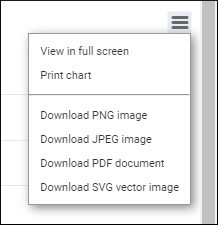
To view the chart in full-screen mode, print or download it as an image or a PDF, use the three-bar menu in the top-right.
# Filtering the Data
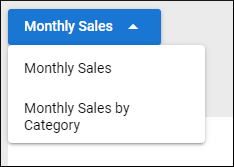
To filter the data by Category, use the drop-down menu in the top-left.
The data points are plotted on the graph for a selected time period.
To change the time period of the graph, you can choose one of the pre-sets from the bar menu in the top-right:

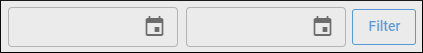
To view the data for a custom date range:
- Enter the to and from dates.
- Enter the dates in the YYYY/MM/DD format.
- To use the date picker, click
 .
.
- Click Filter.
# Working with the Data Points View
- To search for a specific data point, use the search bar in the top right of the data table.
- To export the data to a CSV file, click
 .
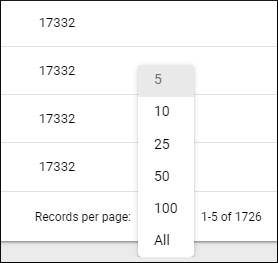
. - To change the number of records displayed per page, use the Records per page menu in the bottom right.